climatecast
an interactive climate and risk reporting tool for U.S. communities
00
problem
Land-use decisions, farm planning, and community resilience work all depend on climate information — but that information is scattered across technical sources, buried in academic and agency formats, and hard to interpret without GIS or climate-science training. For organizations that train farmers, organizers, and neighbors, "go read the IPCC" is not a practical brief. The gap is not curiosity; it is access: a way to see what the science implies for this place, in plain language, without requiring specialists in the room every time.
solution
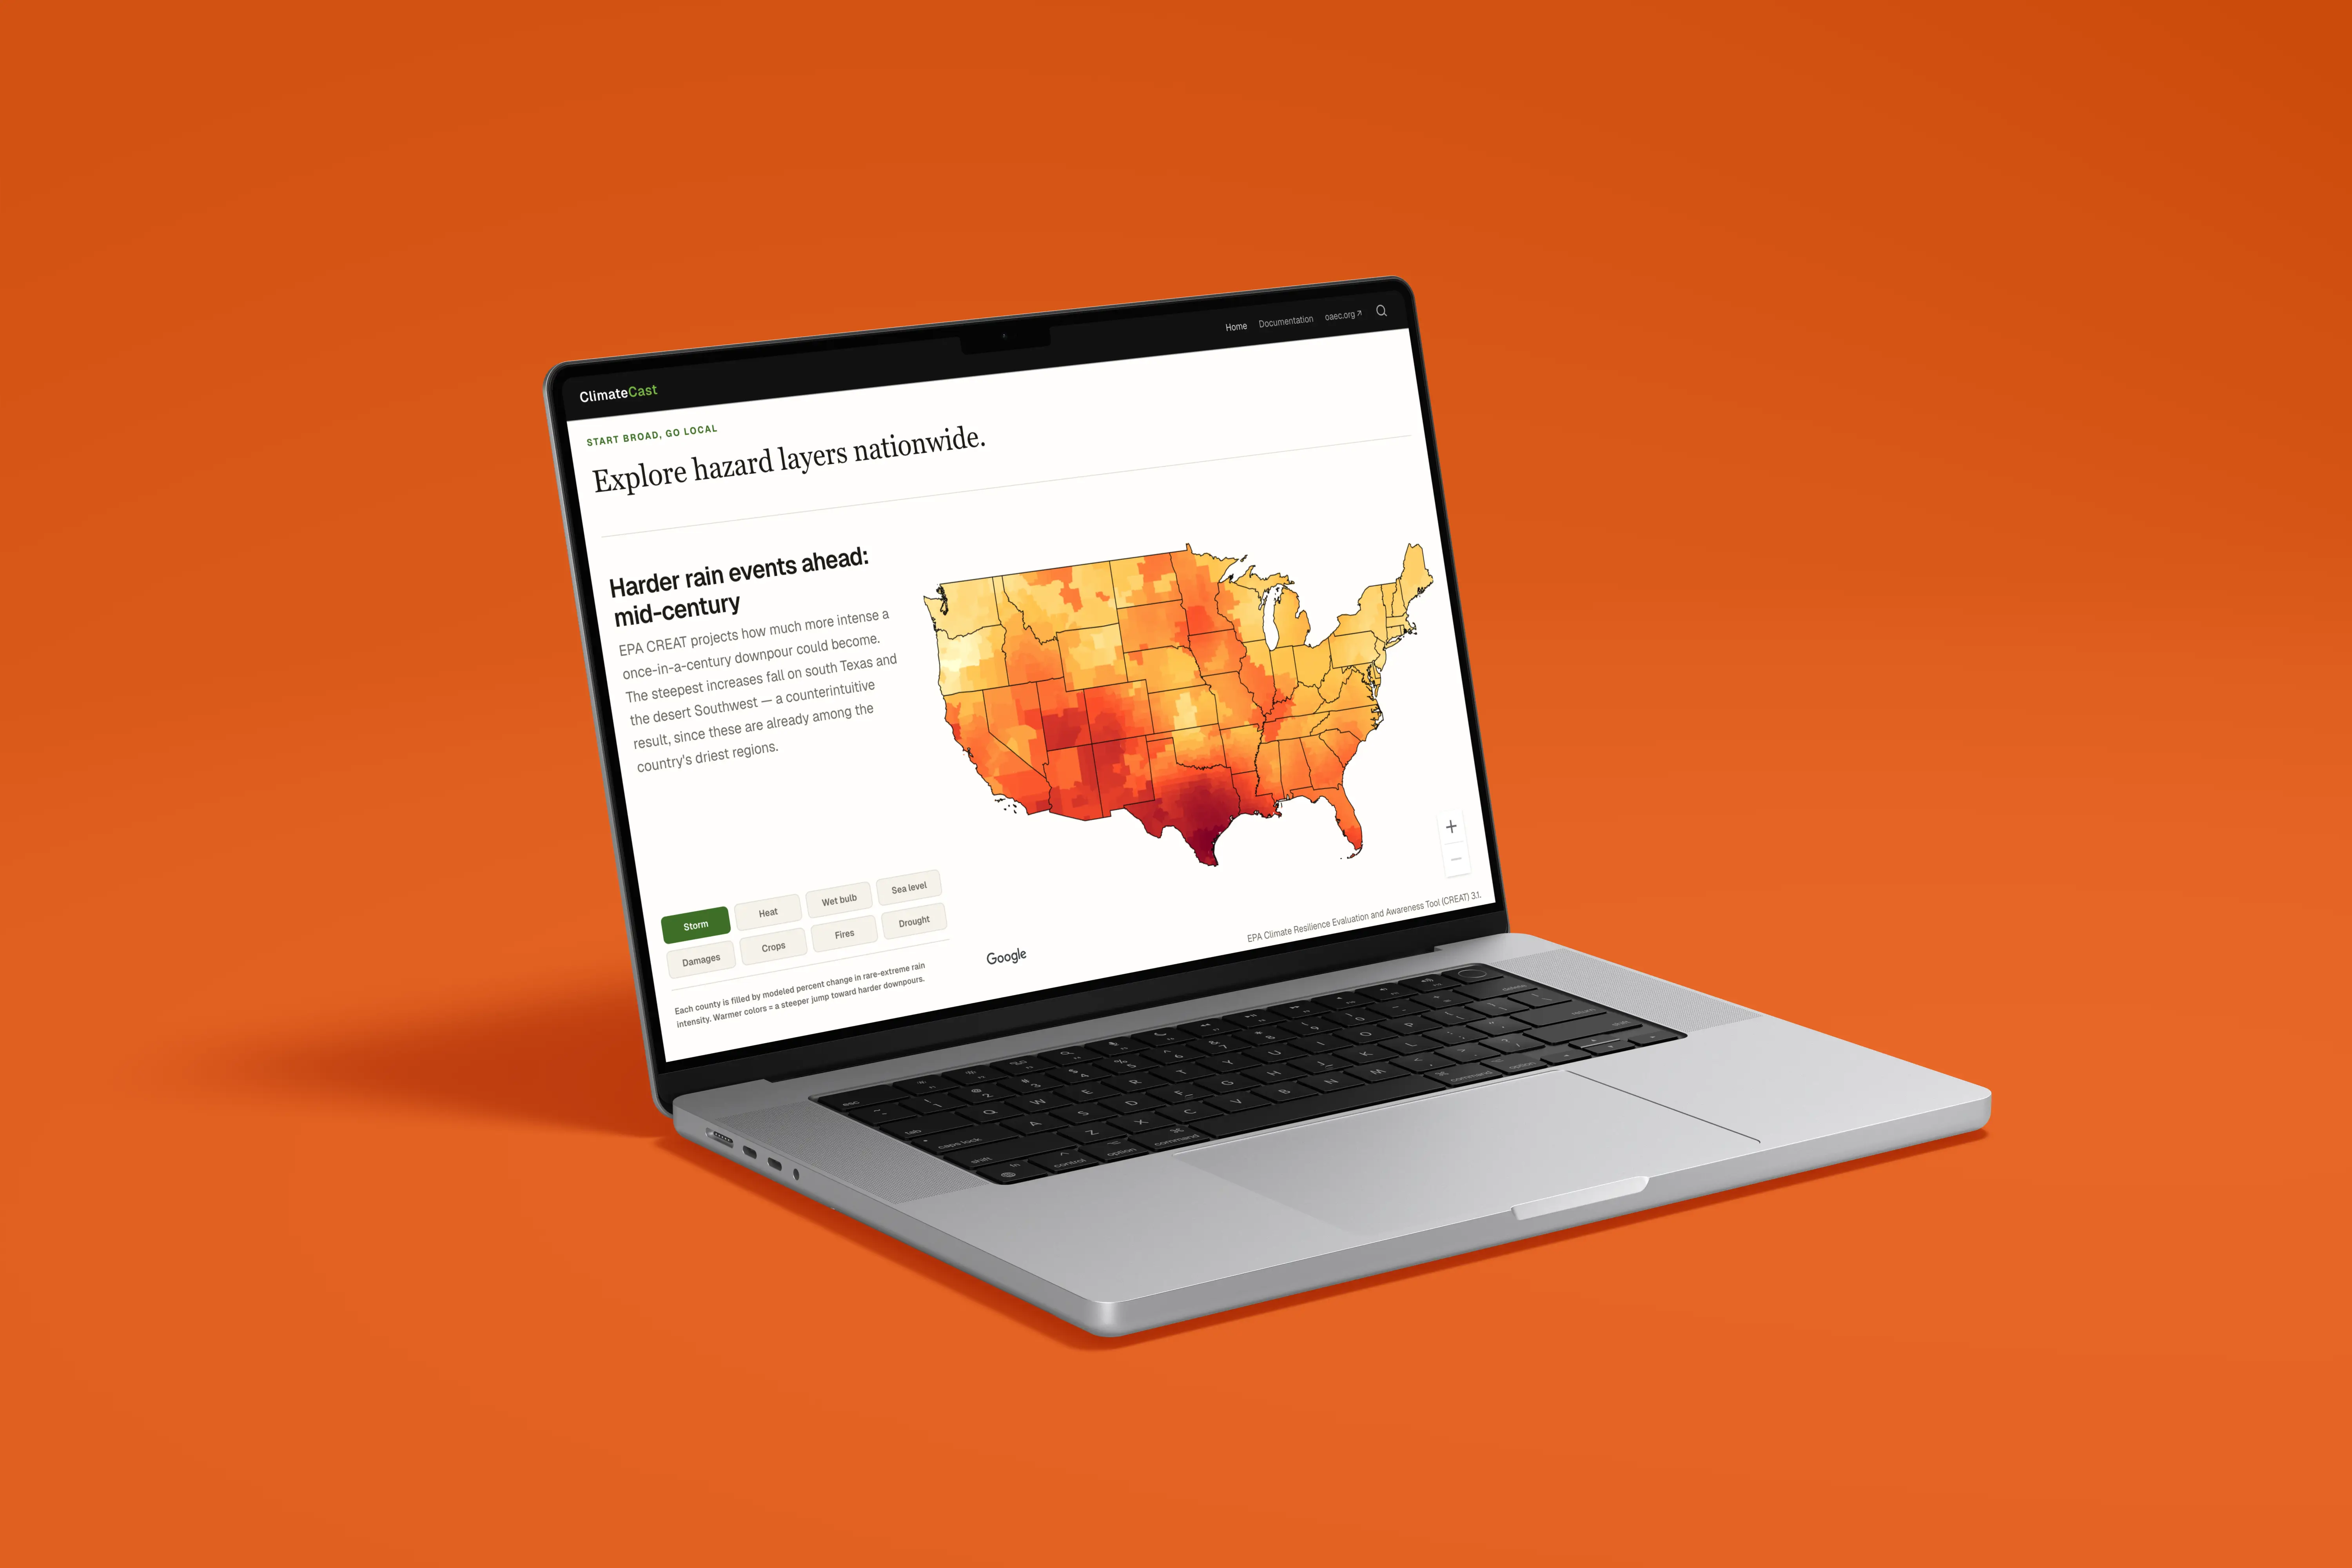
ClimateCast is a web application that generates a location report for any ZIP code in the continental United States — current climate normals, future projections under three emissions scenarios through 2100, county-level hazard indicators, demographics, and an illustrative climate analog that compares a projected future window to historical reference locations worldwide. A reproducible Python data pipeline ingests, transforms, validates, and publishes the underlying datasets; a Next.js front end deployed on Cloudflare Workers serves the results.
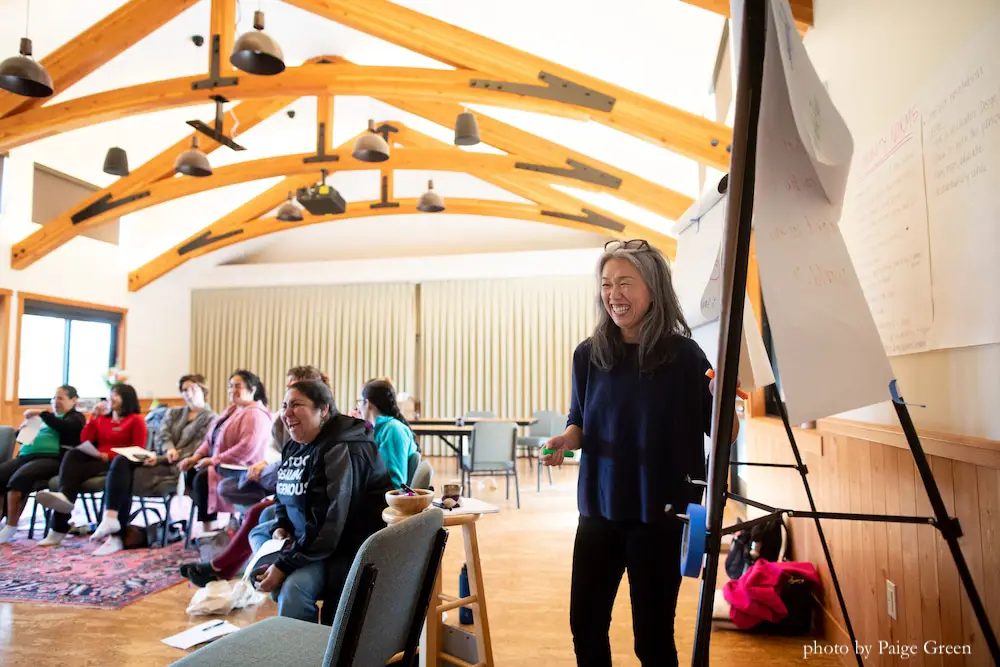
Occidental Arts & Ecology Center (OAEC) is a Northern California nonprofit focused on ecological literacy, resilient food systems, and community collaboration. Their vision and strategy stress capacity-building — shared understanding, not one-off fixes. ClimateCast gives their trainings a common, citeable picture of local climate conditions and hazard context that participants can explore on their own terms.
The core engineering challenge was fusing eight federal and academic data sources — WorldClim climate normals and CMIP6 projections, NOAA daily station records, ProPublica/Rhodium risk scores, EPA storm projections, Census demographics, CDC life expectancy, and USDA hardiness zones — into a single coherent report per ZIP code. A Python pipeline handles the full lifecycle: fetching raw data (tens of gigabytes of rasters and station files), sampling climate grids at population-weighted centroids, merging county-level risk and demographic layers, and assembling roughly 70,000 static JSON payloads. Each stage is idempotent, so individual sources can be refreshed without rebuilding the full dataset. The output lands in Cloudflare R2 with no database in the serving path.
The front end is a Next.js App Router project deployed to Cloudflare Workers. It includes a county-level risk choropleth on Google Maps, scenario and time-period selectors backed by Zustand, and a climate analog feature that matches a user's projected future climate to the historically closest reference location — computed client-side against a pre-normalized catalog of U.S. and international sites. The product needed to be trustworthy enough for educators to stand behind, simple enough for mixed-technical audiences, and maintainable enough to refresh as upstream sources evolve.
Client: Occidental Arts & Ecology Center.
01
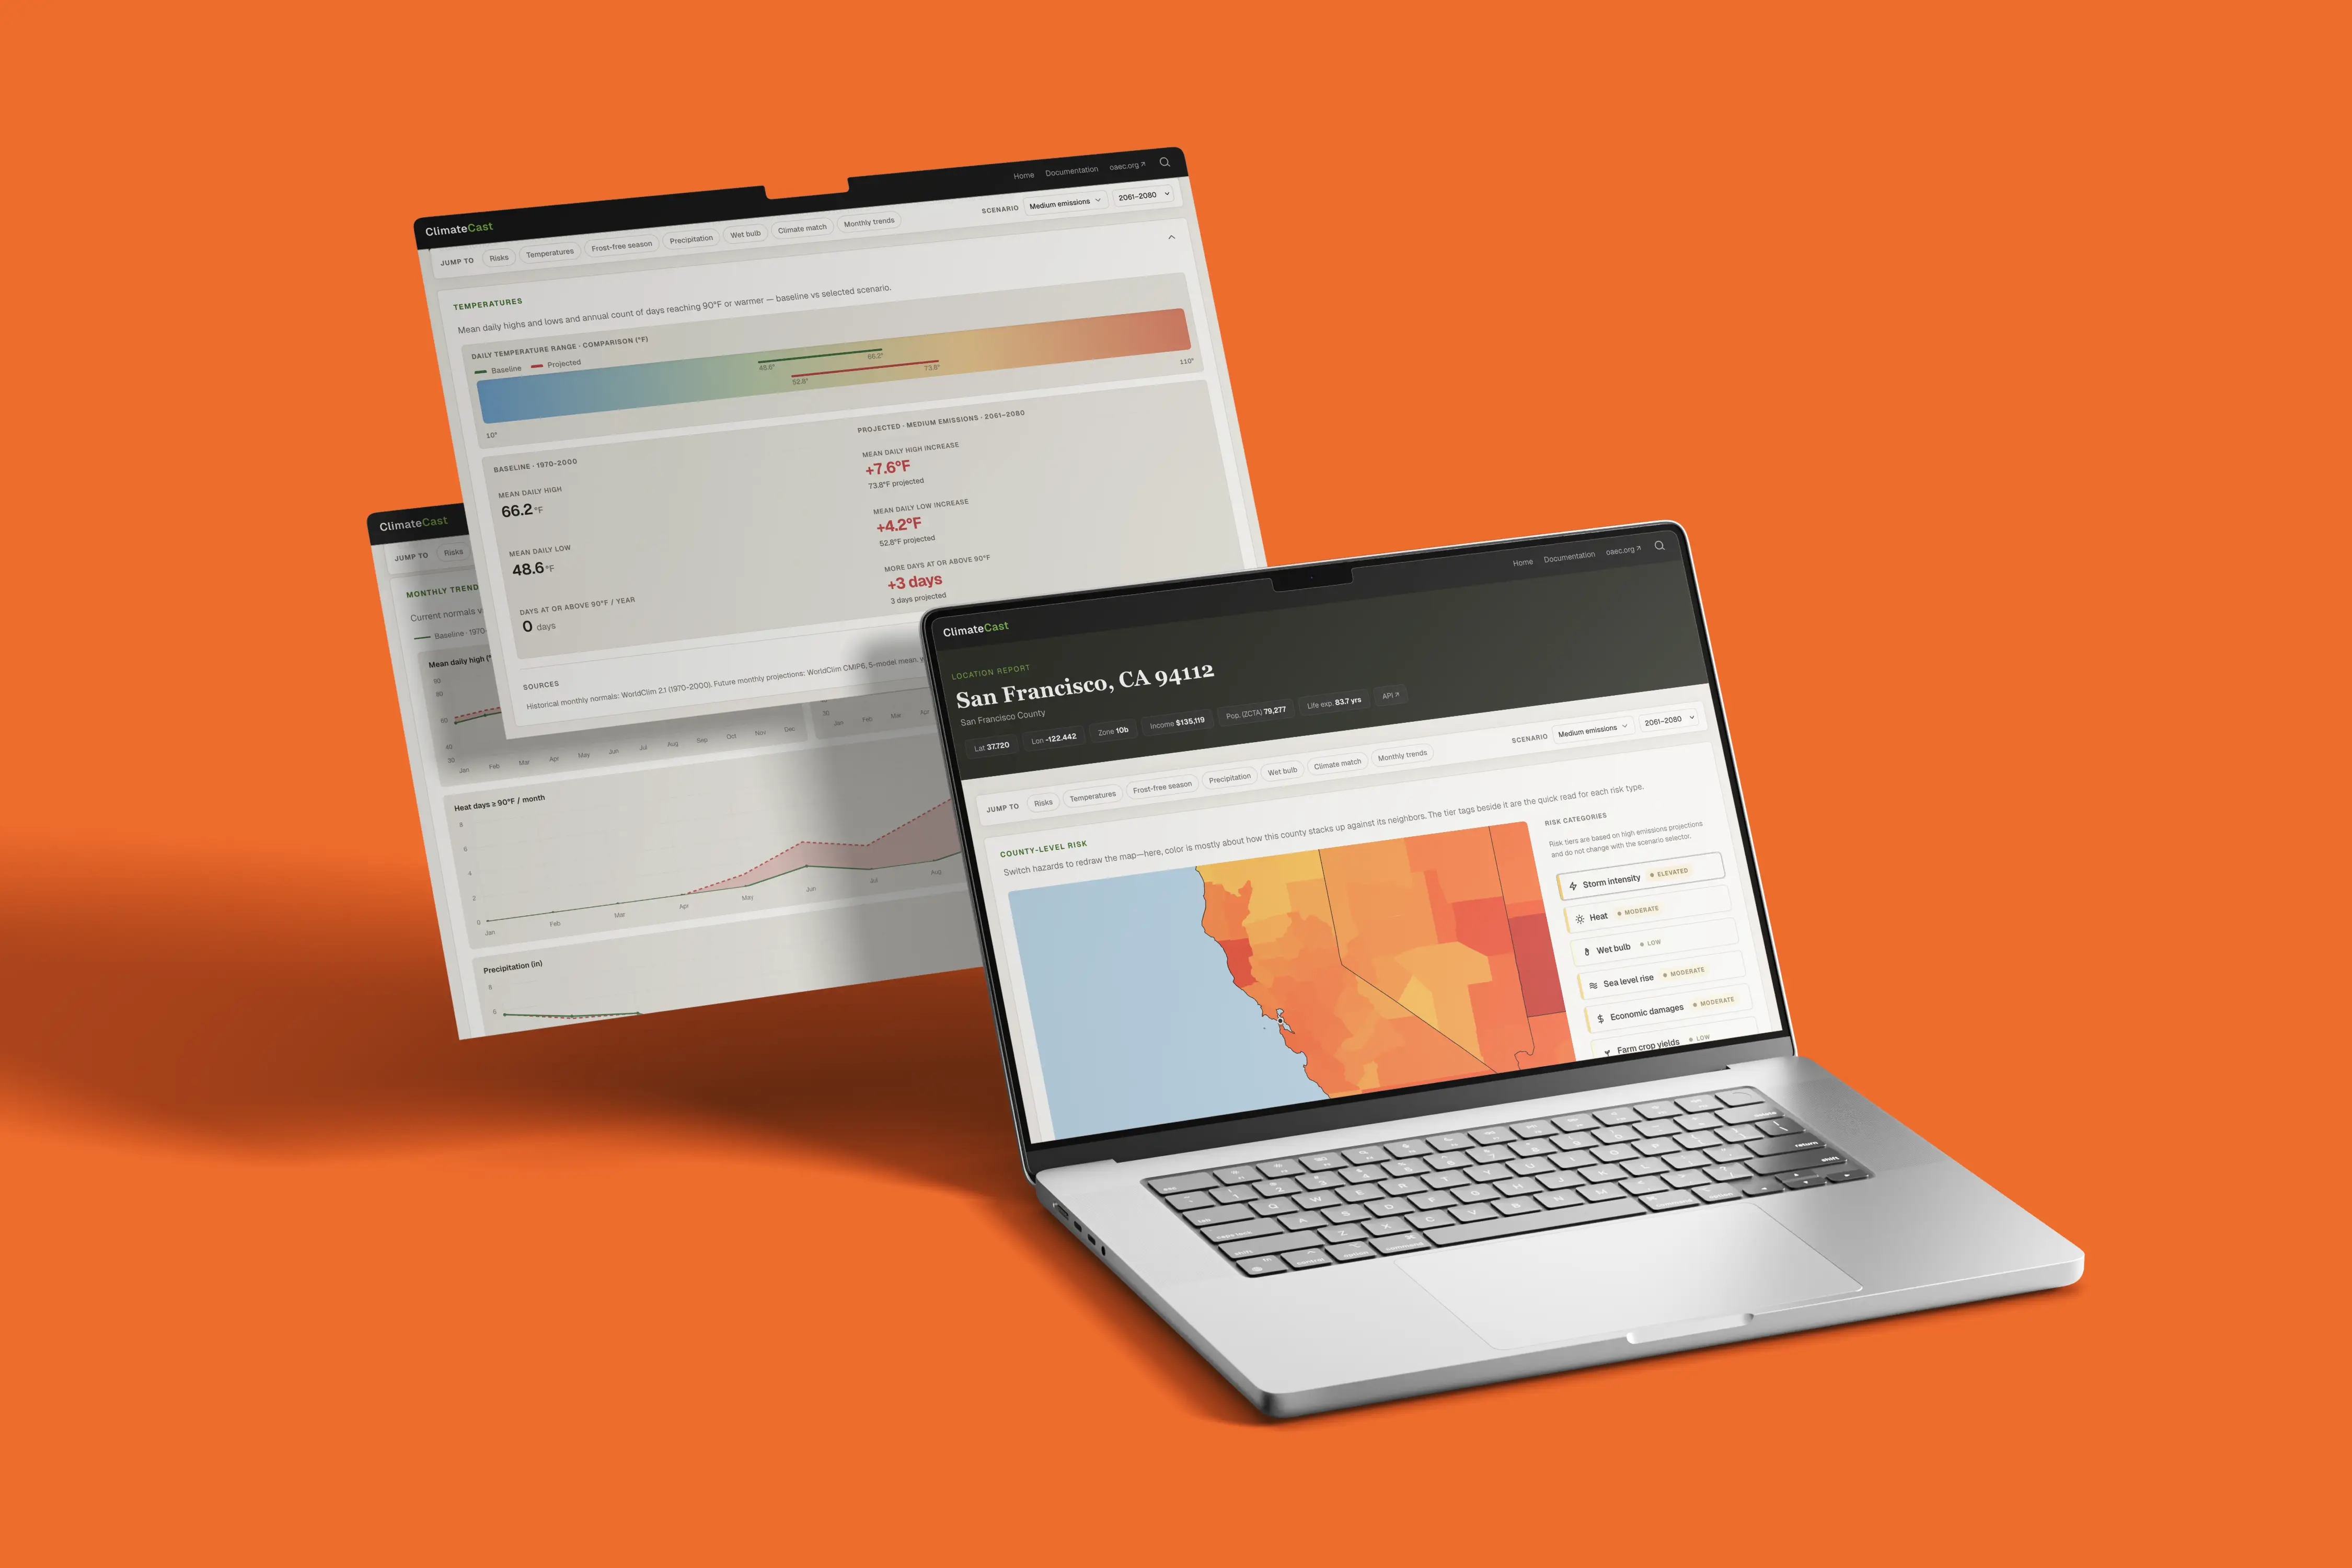
ZIP-level report — scenarios, normals, and hazard layers in one citeable view.
02
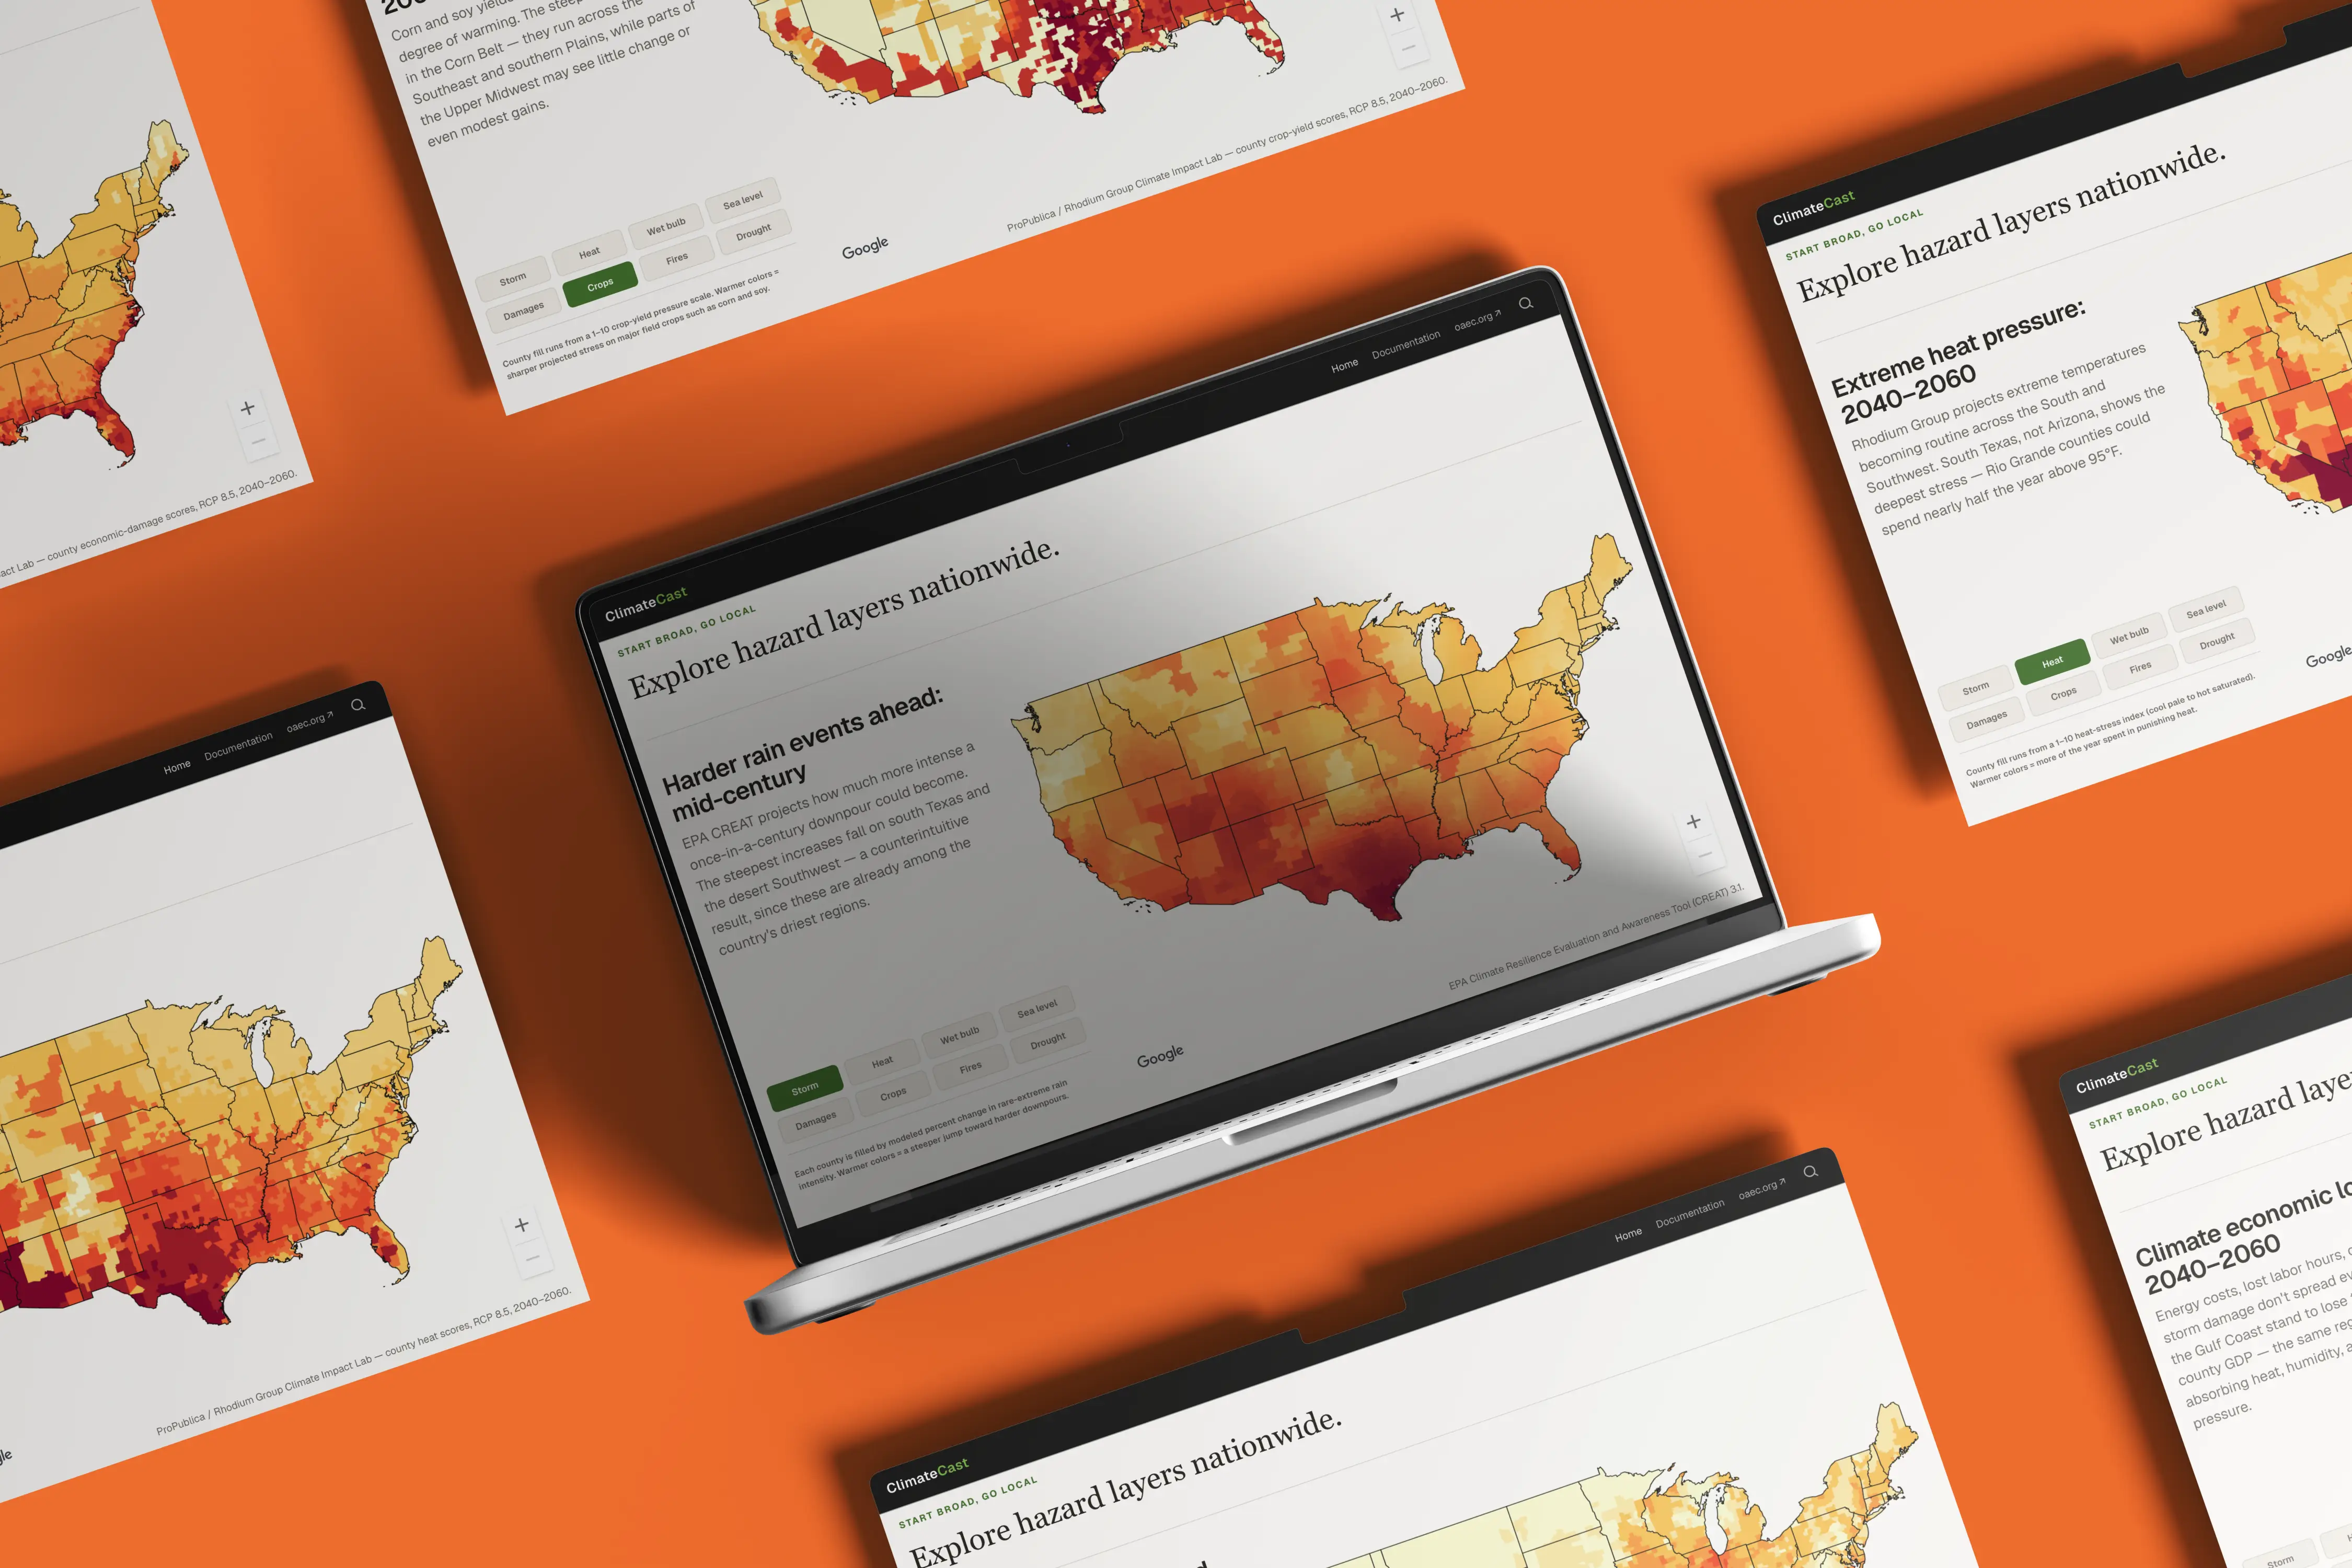
County and national risk context.
03
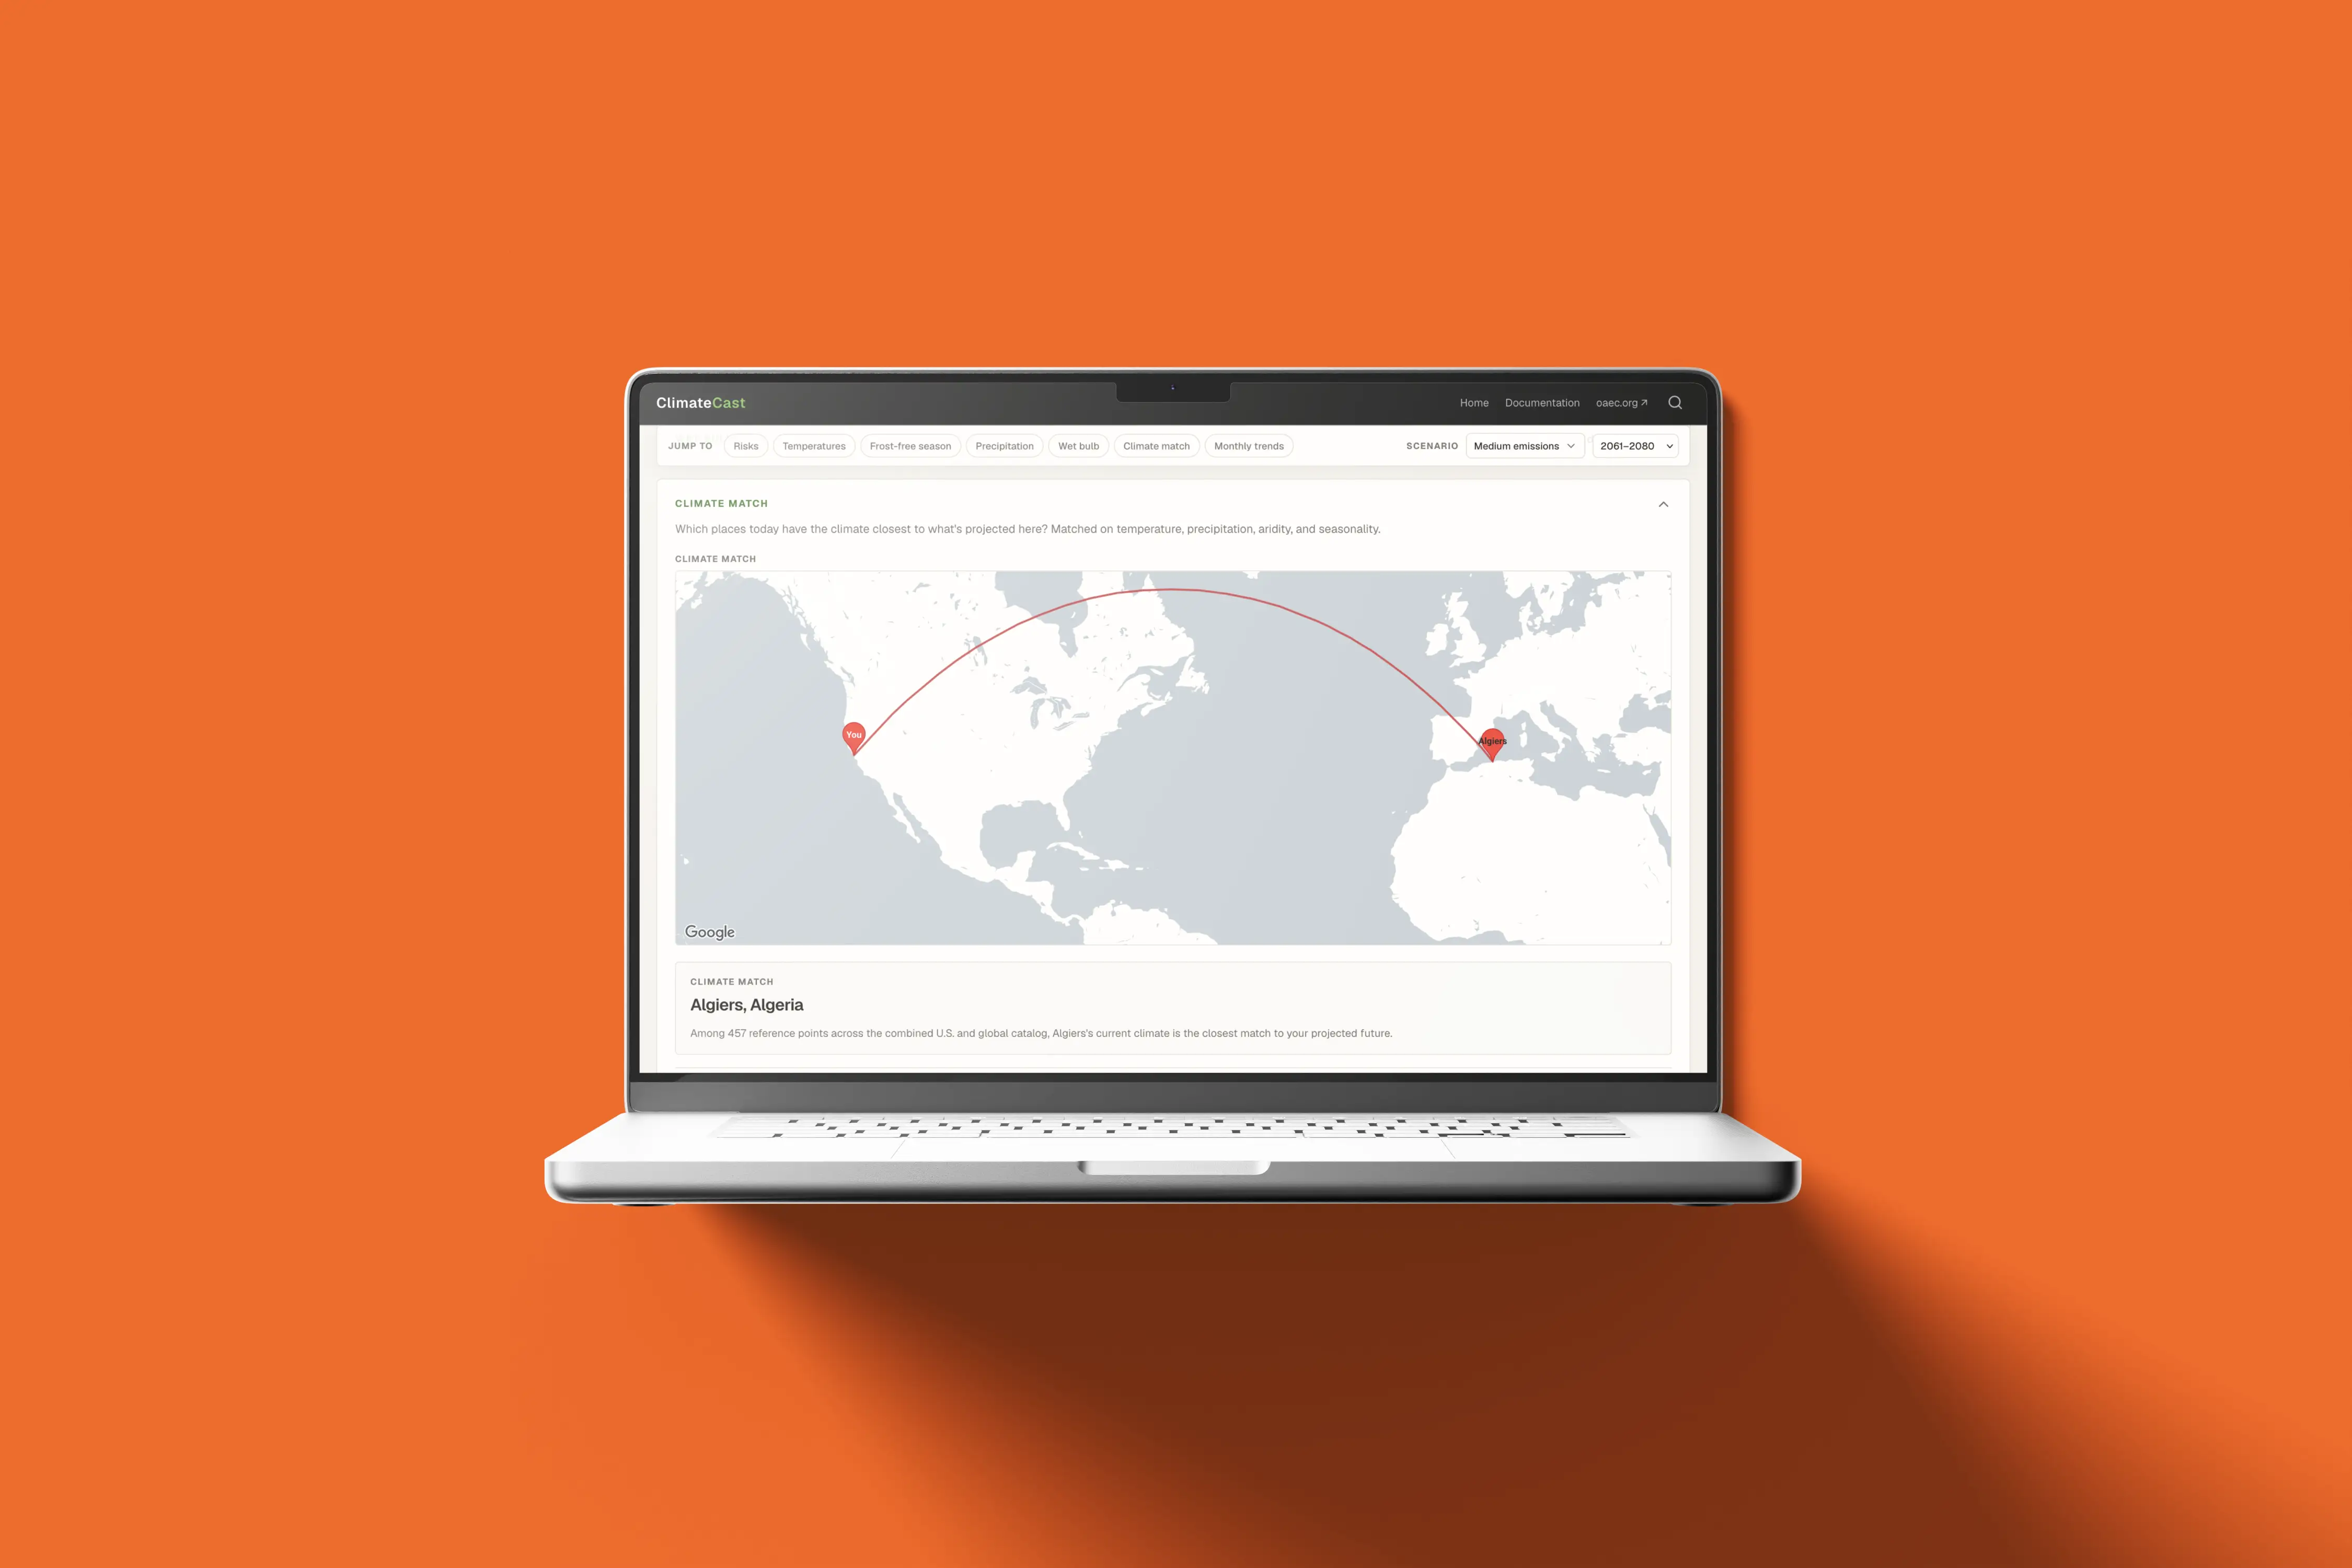
Climate analog exploration.
.say hello
always glad to talk research software, data tooling, or ai. drop me a line and let's find something to build together.